Overview
The PCAWG-Scout takes in the basic data produced by the project, as well as the results from several of it's working groups, and presents it to the user through a collection of diverse reports. These report are centered on entities, or on lists of entities, and are generated on-demand, allowing the user to explore interactively, observing interesting trends and following on then through other analyses.
The design is based on the idea of the Entity: anything that can be
unambiguously identified, and be subject of investigation. Some
examples of entities are: genes, proteins, donors, cohorts (AKA
studies), and pathways, etc. Each entity has a report, which depends
on the type of entity it is. All reports are computed on the fly and
cached. In addition to the main reports, entities have actions,
which are sub-reports that implement particular analyses. For
instance, for gene entities one of the actions is to display a summary
of driver signals for that gene across the collection of main cohorts.
In addition to entities, there are reports for lists of entities, and
for entity maps, which are tables that relate entities to values, such
as genes to their average mutation frequency on a cohort. Entity lists
and maps have their own reports, and can also have actions available
for them.
User interface
The user interface offers a general structure for all reports that allows to enact workflows, explore the results and connect functionalities with one another. This web site is 'responsive', meaning that it adapts to the size of the device you are using: computer, tablet, or phone. On small devices many of the layout elements shift around or get hidden behind toggle buttons to accommodate themselves better to the screen size. The examples below are taken from a computer screen. The site layout and style are under revision so the images might look different, but the functionalities are more or less the same.
- Report structure
-
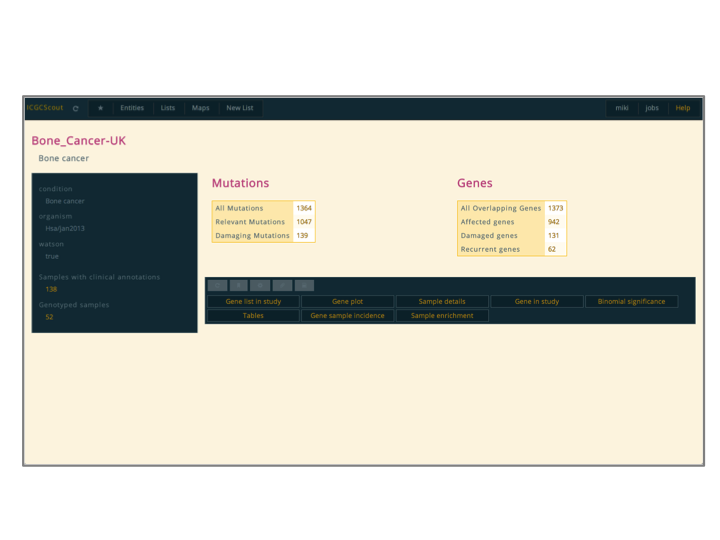
This application presents reports for individual entities, lists of entities, and entity maps. Each type of entity (gene, study, pathway, etc.) has its own report template, and they are prepared on-demand.
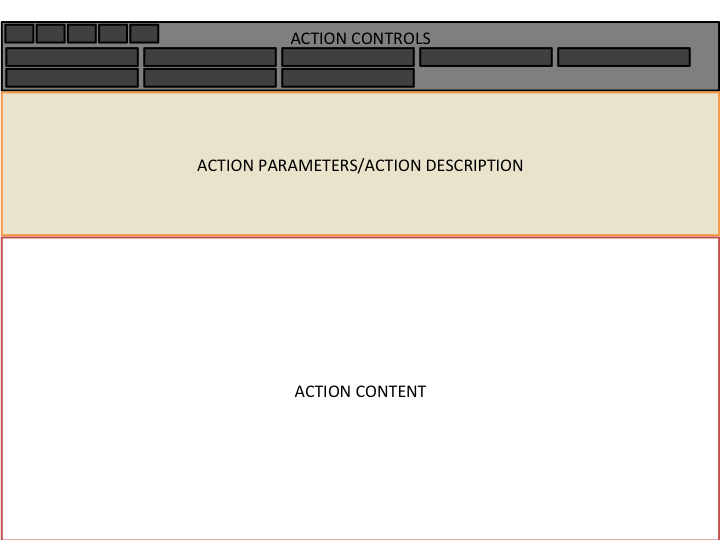
All reports have the same overall structure; the images show a report for a genotyping study from the ICGC project. The top-bar is always there and provides a placeholder for several functionalities, most importantly the control of
favourites.Bellow the top-bar comes the report itself. It consists of a title, a side-bar, a description, and an
action controller. In general the side-bar is used to show general meta-data about the entity and the description to show a brief overview.The action controller offers access to
actions, which are like sub-reports. Each type of entity has its own actions. If the entity type in particular does not have any action defined then the action controller will not be displayed. When an action is selected, it will be displayed below, in the area called action loader.Actions can also be opened in their own page, clicking the middle-button like any link. These pages are like reports but with no action controller or side-bar
- Snapshot
-
- Explanation
-

- Top-bar
-
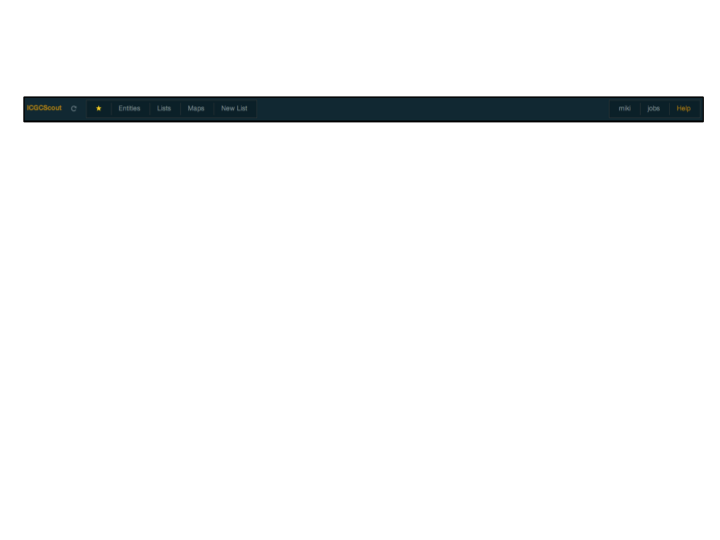
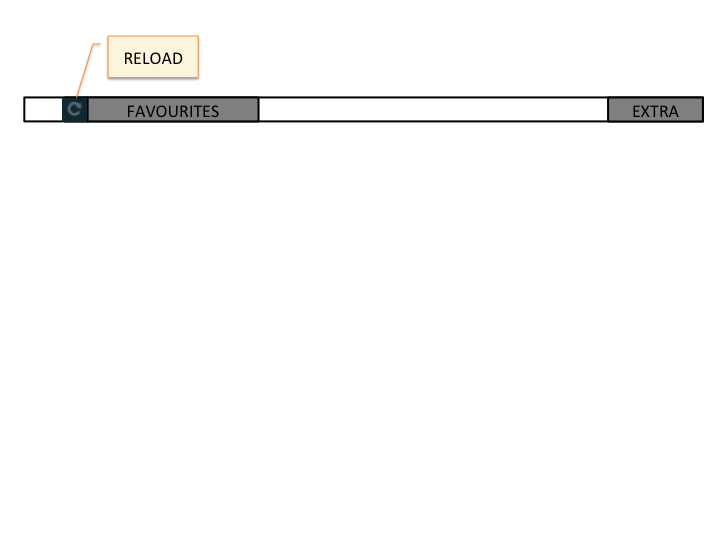
The top-bar provides access to several functionalities. Clicking on the title of the application will link to its front-page. Next to it is the reload-button, which is used to force the server to recalculate a report, otherwise the report will be taken from a cache. This is useful when a report has given an error or when when it was updated somehow. Note: After a reload of the report, the browser might still try to get the file from its own cache, so you might need to use the reload button in the browser as well; I'm planning to fix this.
Next is the
favouritescontrols, which we will discuss shortly. After that there might be a search box, if the server was started with that functionality. This search box can be configured to identify any type of entity, but generally it is only genes.The final component of the top-bar, which I label "User", has the user controls, which allows to login or logout, and the job bookmarks, where bookmarked actions are kept. Also this help page. Will discuss bookmarking actions latter.
- Snapshot
-
- Explanation
-
- Favourites
-
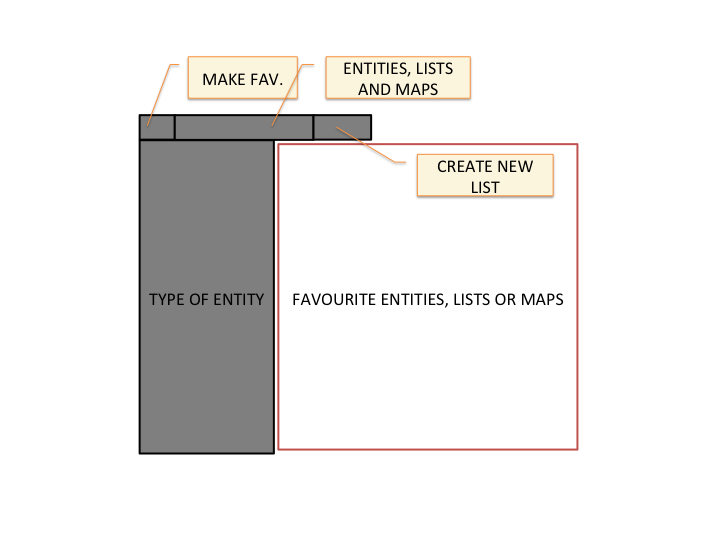
As we said before, we have reports for entities, lists, and maps. Clicking the star on the favourites control makes a favourite out of what-ever we are viewing: an entity, like a study; a list of entities, such as the genes mutated in the study; or a map, which could for instance map genes to the ratio of mutations per amino-acid in the COSMIC database.
Favourites are used not only to track our interests, but as a means to communicate between different functionalities or parts of the application. We could for instance make a list of genes a favourite and then go to a study report, open the "Gene list in study" action, select our list from all the favourites and see a report of how these genes are affected in the study
The favourite controls have an option to create a new list of entities from scratch. This allows a user, for instance, to make a list with her genes of interest instead of having to browse the application to find it. Note: New lists are not made favourite be default, you still need to click on the star once the report is shown.
- Snapshot
-

- Explanation
-
- Actions
-
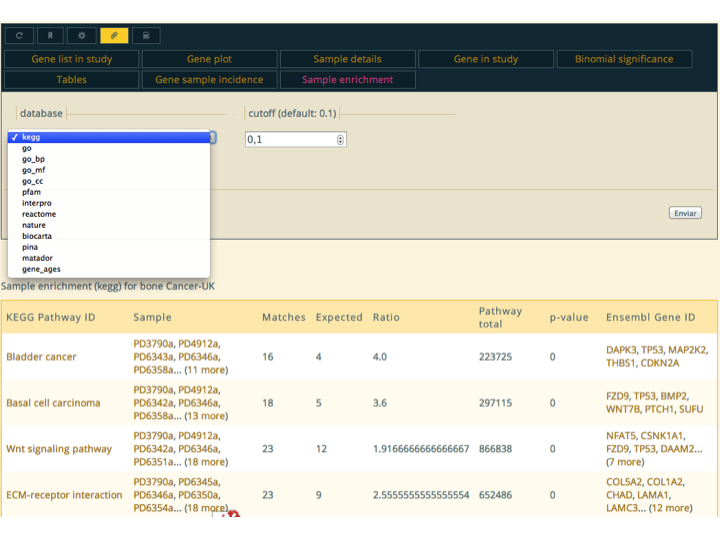
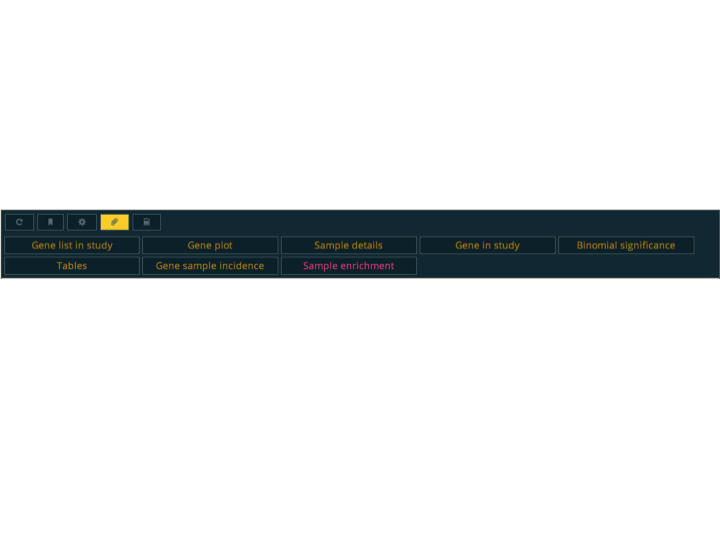
Actions are the primary way to integrate data and functionalities. Some actions are defined globally, but most commonly they are defined inside workflows; when a report is produced, all workflows are interrogated to see if they provide actions for it. The great majority of the actions are defined in the
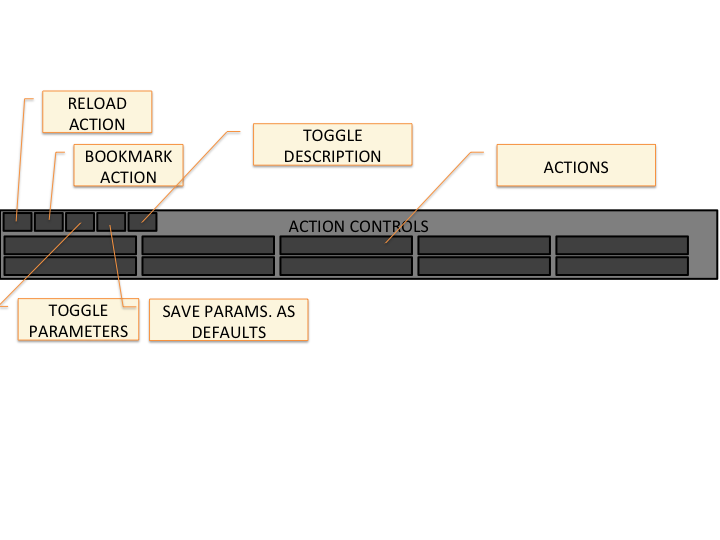
Genomicsworkflow.When an action is selected, it loads below the action controller. An action report consists of the content of the action, and optionally, documentation a report the parameter controls and description are hidden, but they can be shown using the action control buttons in the top left of the action controller. Actions can also be opened in their own report by right/middle clicking on its button.
As with all reports, they are executed the first time they are requested and the result is cached for further access. The action control buttons can be used to reload the action, just like the reload button in the top-bar does for the complete report. The actions will of-course be recomputed for each configuration of parameters. The parameters of the action can be favourites from the user, lists or maps. These are presented to the user using an input
select, and are synchronized with the user current favourites.If an action is used often with a particular combination of parameters. For instance the "Enrichment" action of gene lists performs an over-representation based analysis of functional classes. The functional classes include several pathway databases, protein domains, gene ages, etc. If we where interested primarily in performing enrichment analysis using GO biological process terms, we can use the paperclip button to set that configuration of parameters as default, so that it always uses it initially.
Some actions may require a significant amount of time to compute. The action controller tries to reload the action periodically until it is completed (after a while it will stop insisting to not overload the server). Instead of having to wait on that page for it to finish, the user can click on the bookmark button, which will place a link in the "jobs" tab on the "Extra" menu of the top-bar, and come back to it later.
- Action Snapshot
-
- Action Explanation
-
- Controller Snapshot
-
- Controller Explanation
-
- Tables
-
Tables in this application come enhanced with several functionalities. The rows can be sort by the values of any column.
The values of the columns can also be used to filter the rows of the table through the
filterbutton. The filters are defined per-column, and can contain exact strings, regular expressions like/(COMPLETE|PARTIAL) RESPONSE/i, statements such as> \< ==or!=. And columns containing entities they can be prefixed with the termname:to force the filtering to work over the human readible text of the entities e.g.name:/SF3B\d+/for a column containing 'Ensembl Gene ID'.When a column contains entities, these are usualy listed in the table using some identifier like 'Ensembl Gene ID' for genes or 'GO Term IDs', etc. When displaying the table, it automatically substitutes these identifiers with links to their corresponding reports, and lists them by name. Additionally the
columnbutton allows the user to report the list of entities of any column or, if the first column is itselve an entity, it allows the user to report themapbetween the entities in this column and the values of any other column. Maps are generally used as inputs to actions and tools, but may have actions as well; gene maps have an action that performs a rank-based enrichment analysis (provided the Enrichment workflow is loaded in the server).The content of the table can be downloaded in two forms, as TSV files, which is the original source of the table, or as Excel files. When downloding as Excel files, since are generally intended to be read by people, all entities listed that can be translated to a more human readible identifier are translated automatically. This includes change genes identifiers from
Ensembl Gene IDtoAssociated Gene Name, or changing KEGG pathway ids to their descriptive name.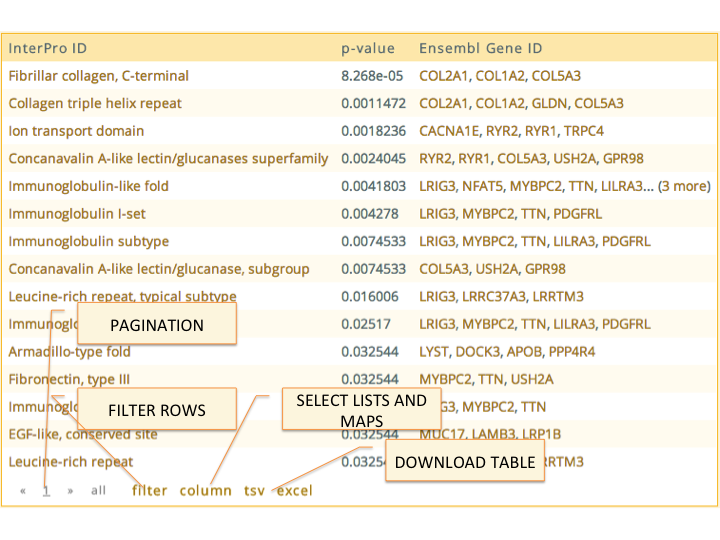
- Tools
-
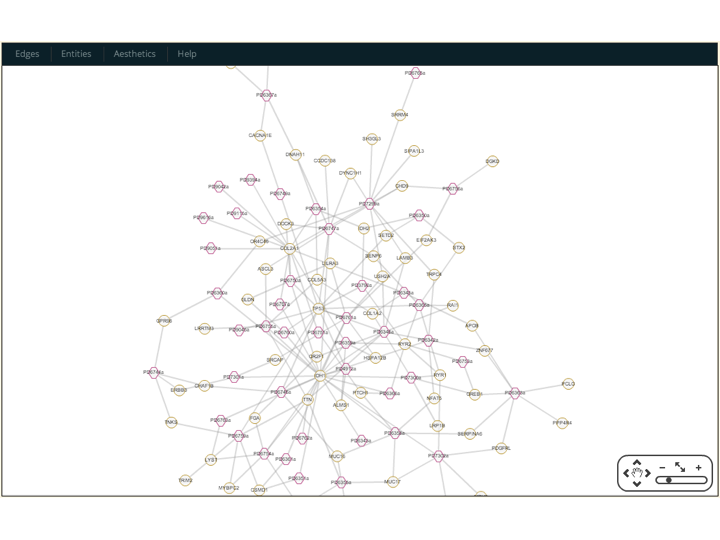
Some workflows implement
tools, which provide special interactive visualization for different types of data. For instance: theGraphworkflow implements thecytoscapetool, which is used to display different kinds of entities connected through databases or analitical results (defined asknowledge_bases, but that is a subject for another discussion); theStructurejmoltool displays mutations in the secondary and tertiary structures and complexes; and theD3Jsworkflow that implements a tool to displayd3jsinteractive SVG figures. Alternative R is used through a native interface in Rbbt to display plots usingggplot2.These tools are used by different reports and actions. The
Graphworkflow for instance redefines the template forGenelists to include a cytoscape plot to the description section of the report.- Cytoscape
-
- Jmol
-
- D3Js
-

Prost-AdenoCa and SPOP
This use case is feature in our article - Online resources for PCAWG data exploration, visualization, and discovery
It's well known that structural variants affecting the ERG gene, in particular those that put the gene under a different promoter, are usual drivers in prostate cancer. In this use case we aim at identifying these cases and determining what could be driving the rest.
1. Visit the cohort page
Start by selecting the Prost-AdenoCa cohort from the cohort selection page on the main page. Perhaps you would like the make it a favourite by clicking on the start on the top bar.
2. Examine Strutural Variants
By loading the report action SV summary you will see a table that lists all potential cases that might be fusing two genes. This table shows each candidate fusion along with the genes involved and the donors that suffer such 'candidate fusions'.
The Prost-AdenoCa has gene expression data for several samples, enough to perform the expression analysis. If we sort the table by the field 'Best Fisher p-value' we will see the first entry (and the only significant) to be the ERG-TMPRSS2 fusion, the most well know case. Following it is the ERG-SLC45A3, also quite prevalent but which does not involved enough donors for which we have gene-expression to achieve a significant result. We know from literature that the former fusion is functional, and this is reinforced by the gene expression results; we will consider the later fusion as functional as well because of it's parallelism, despite lacking the same level of evidence.
3. Take the ERG positive donors
To further our investigation we will construct a list of donors that contains the ERG positive donors, those that have an ERG- fusion. The simplest way is using the functionalities available on the table itself.
We will do this on two steps: (1) click the filter button and filter the table for entries containing ERG on the column 'Gene 1' and (2) click the column button and then the button save list next to the header 'Fusion donors'. This will create a list of donors and open its report on the model window. Use the link on the top of the modal window to open directly on a browser tab.
At this point it's good to spend some time house-keeping. The list of donors now has a very unintuitive name such as 'List of sample in table 98210'. Let's rename it. Click on the 'hamburger' icon to open the side panel for this report. There you can find the Edit button. Let's use and replace the field 'list_id' by something like 'ERG fusion Prostate donors'. Now let's make that list a favourite by clicking on the start on the top bar; this time it's important.
4. Take the other donors
The list of donors that we just created, and made a favourite, are though to have tumors driver primarily by the ERG- fusions. However we set out to shed light onto what mechanisms would explain the tumors on the other donors. To do this we need to form another list of donors, those that don't have the ERG- fusions.
First go back to the Prost-AdenoCa cohort report (maybe you can finding it on your favourite Study entities). Now click on the link 'Registered donors' or 'Genotyped donors'. This will take us to a donor list report like the one we saw before. What we will do now if remove the ERG positive donors from this list. To do that use the 'hamburger' icon to open the side panel and click on Compare button. If you didn't disregard the instructions of making the previous list a favourite, you should see an entry on the modal window with three buttons next to it. Click on the Remove button and you will arrive at your desired list of non ERG- fusion donors. The name of this list is already informative, but let's edit it into a more succinct form: 'Non ERG fusion Prostate donors'. Let's also make it a favourite while we are at it.
5. Check what is special to them
Now that we have our list of non ERG fusion donors, let's try to find what drives their tumor. Click on the action Characteristic alterations. This report will immediately show a few genes that seem to have more prevalence of mutations in this list. One of them is SPOP.
6. Examine SPOP mutations
Click on the SPOP link to go the to its report page; make it a favourite. Click on the 'hamburger' icon to open the side bar and select the top most isoform '(SPOP) ENSP00000240327'. You have arrived at the protein report page; make that a favourite as well.
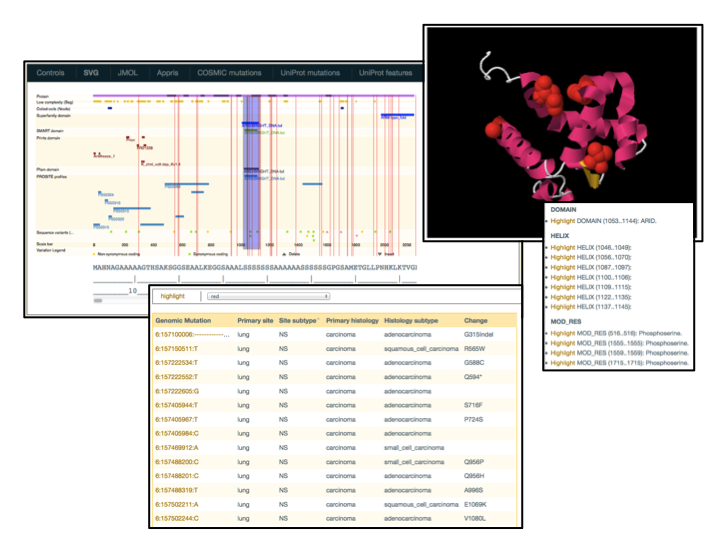
Let's open the tab called 'PCAWG' and click the highlight button. Go back to the 'Sequence' tab. You know see that overlying the sequence drawing (that comes from Ensembl) are some vertical lines. There is a cluster or light blue lines around amino-acid residue 133. Guess what? Light-blue is the official color given by the project to Prost-AdenoCa.
Let's know click on the action called Protein feature incidence. We see from the top hits that residue 133 is involved in binding substrates. If we are luck we will find PDB models of interactions of SPOP with different substrates in the 'PDB-viewer' tab. In fact we are in luck and we find models of SPOP interacting with CUL3, PTEN, and H2AFY. The PDB with CUL3 does not cover the 133 residue, but the other two do cover it. Let us open the one called 'SPOP-PTEN (28..166) experimental - O43791-P60484-EXP-4o1v.pdb1-A-0-B-0.pdb'. We see the SPOP protein and a fragment of the PTEN protein close to it.
We can now again click on the highlight button in the 'PCAWG' tab to see the residues colored using a gradient based on the density of mutations. We can see how mutations tend to be in proximity with the interaction interface with the fragment of PTEN, and the 133 in particular in a strong red color.
How to install your own instance
Please refer to the Getting started with Rbbt for instructions on installing Rbbt on our system.
On a working installation you will need to place
some data files you need access to in any of the directories
/usr/local/share/rbbt/data/projects/PCAWG/.source,
/usr/share/rbbt/data/projects/PCAWG/.source,
~/.rbbt/share/data/projects/PCAWG/.source or
somewhere else if you configure the path in ~/.rbbt/etc/search_paths
These files are:
October_2016_whitelist_2583.snv_mnv_indel.maf.gzautoremoval_final_submission_pkg.tar.gzconsensus.20170119.somatic.cna.annotated.tar.gzjoint_fpkm_uq.tsv.gzpcawg_consensus_1.6.161116.somatic_svs.tar.gz
The SNV and MNV file is considered sensitive; if you don't have access to it
you may still run the instance by placing the following text in a file file under
~/.rbbt/etc/remote_workflow_tasks
---
Sample:
  http://rbbt.bsc.es/Sample/Sample:
    - num_genomic_mutations
    - mi
    - all_mi
    - compound_mutation_genes
    - homozygous_genes
    - missing_genes
    - gene_mutation_status
    - gene_extra_status
    - pandrugs
    - context_change_count
    - gene_timing
Study:
  http://rbbt.bsc.es/Study/Study:
    - binomial_significance
    - sample_enrichment
DbNSFP:
  http://rbbt.bsc.es/DbNSFP:
    - score
    - annotate
    - predict
    - possible_mutations
You can now install and bootstrap the PCAWG workflow, which means preparing the basic results for all donors and cohorts
env RBBT_WORKFLOW_AUTOINSTALL=true rbbt workflow cmd PCAWG bootstrap
Or you can start this same web interface
rbbt app install PCAWGScout && env RBBT_WORKFLOW_AUTOINSTALL=true rbbt app start PCAWGScout -e production --log 2 -p 2887
Note that bootstrapping the infrastructure can be as lengthy and bootstrapping the PCAWG workflow itself. In particular the DbNSFP workflow used for damage predictions requires building a 200GB database, so we recommend to use it remotely, at least at first
rbbt workflow remote add DbNSFP http://rbbt.bioinfo.cnio.es/DbNSFP
You may also circumvent plenty of work by configuring one of BSC servers as a remote file server, which is then queried for files before trying to generate them locally
rbbt file_server add Organism http://rbbt.bioinfo.cnio.es
rbbt file_server add InterPro http://rbbt.bioinfo.cnio.es
rbbt file_server add Genomes1000 http://rbbt.bioinfo.cnio.es
rbbt file_server add DbSNP http://rbbt.bioinfo.cnio.es
Alternatively you can just instruct it to query just any file
rbbt file_server add '*' http://rbbt.bioinfo.cnio.es
Note that some of these datasets might have legal constraints. So if you plan to use this commercially please deactivate file_servers and download everything from source, though this will likely mean fixing outdated references.
If you can follow these suggestions and get a running instance I would like to meet you! In the more likely event that you need further instruction please contact me (see contact info below)

